
![[Company Logo Image]](../images/sphere_smooth.gif)
|
|
|
|
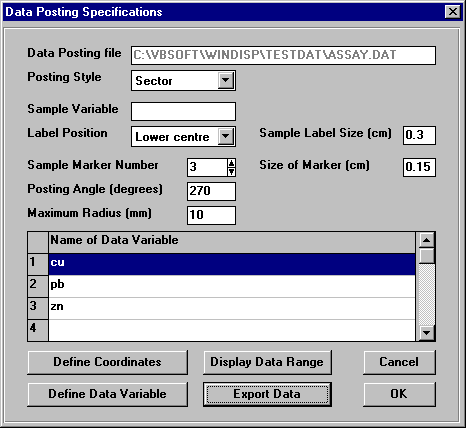
WinDisp Sector Posting MenuSector PostingThis option allows data values to be displayed as a Pie type plot in which the radius of each sector is related to the data value assigned to that sector. When Sector posting is selected the Data Posting Specification menu has the following form:
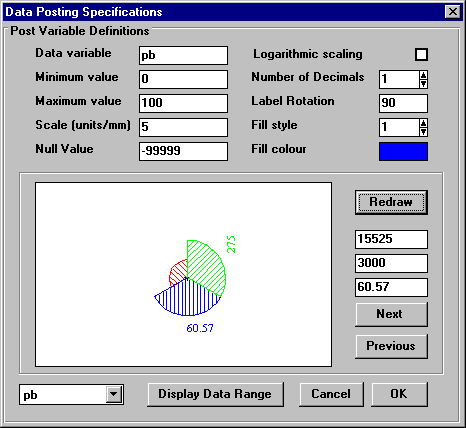
This menu display contains a number of standard items which are displayed for all menu styles and a number of items which are specific to the particular posting style. General Posting OptionsSector Specific SpecificationsWith sector posting up to sixteen data values can be selected. These data values are chosen from the available data items by clicking in the grid cell under the column heading Name of Data Variable in the preferred row in the data definition grid. These rows do not need to be defined contiguously, and any valid row will be posted on the display. Clicking in any cell in the Name of Data variable column brings up a drop down box from which the desired data variable can be chosen. Maximum Radius With sector plotting, the radius of each sector is related to the data value assigned to each sector. As some data variable may have a few large values, setting the maximum radius to a value appropriate to the separation between data points will prevent these large values from overposting neighbouring data points. When a value is encountered which would otherwise have resulted in a sector whose radius was larger than the specified maximum, the sector radius is set at the maximum value and the data value is posted as a text label using the Post Sample Label Size parameter. Display Data Range button Once the coordinates and required data variables have been defined, the user can check the range of data values contained in the file by clicking on the Display Data Range button. Clicking on this button brings up the Data Range Menu. When this button is clicked for the first time, the currently selected data variables are read from the file and stored in a temporary binary file to speed future access to the data. This temporary file will be retained for the current WinDisp session or until it becomes invalid through a change to the data variables chosen or the line variable, so it is recommended that all data of interest are selected on first entering the Data Specification menu. Define Data VariableAfter specifying the coordinates and required data variables and the area limits and map scale, the parameters determining how the individual data values will be posted need to be specified. This is achieved by clicking on the Define Data Variable button. This will bring up the parameters for the currently selected line in the data definition grid, or the first variable specified in the grid if there is no currently valid selection. Clicking on the Define Data Variable button brings up the following form:
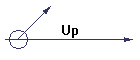
Data Variable This displays the user name of the currently selected data variable. Minimum Value This value specifies the minimum value for which the data marker will be displayed. If the data value is less than the minimum only the sample marker (if one is defined) will be displayed at the data location. If this value is set to be equal to or larger than the maximum value, the minimum limit is ignored. Maximum Value This value specifies the largest value which is to be used for displaying the data marker. If the data value is larger than the maximum value it is simply truncated to the maximum value. If this value is set to be equal to or smaller than the minimum value, the maximum limit is ignored. Scale This value represents the scale used to convert the data value into sector radius. The value is interpreted as units/mm and so must be a positive value. The radius of the sector plotted is computed using the formula:
Note that the Maximum Sector Radius parameter on the main Posting Specification menu overrides the computed radius. Null Value This text box displays the null data value for the current data variable, this value is provided for information only and the null data value should be changed on the Specify Data Names menu Logarithmic Scaling This check box specifies if the log (base 10) of the data value should be used in posting the data. Number of Decimals This integer value specifies the number of digits after the decimal point to be used in displaying numeric data values in text format. Label Rotation This value specifies the rotation to be applied to the currently selected data variable and is measured in degrees positive counter clockwise about the centre of the label position. This rotation is applied after any posting rotation specified on the main Posting Specification menu. Fill Style This index specifies the type of fill to be applied to the sector for the currently selected data variable. A value of -1 indicates that no fill pattern should be used, a value of zero indicates that a solid fill, and values greater than 1 select various type of hatching fill patterns. Fill Colour This box displays the pen colour which will be used to display the perimeter and interior fill for the currently selected sector. In addition if the sector radius is larger than the specified maximum radius the data value will be posted using this pen colour. If the colour needs to be changed, click on the colour box to bring up the Pen Colour Specification Menu. Posting Preview WindowIn the lower part of the Post Variable Definition menu is the Posting Preview Window. If the current display area limits and map scale are defined and valid, this window displays the currently defined posting style. As the posting specifications are changed, the suitability of the choices for the parameters can be checked by clicking on the Redraw and the Next and Previous buttons. The x, y and data values are also displayed in the text boxes on the right of the preview window. Selected Data Variable Drop-down BoxAt the bottom left hand corner of this form is a drop-down box containing a list of all data variables currently specified in the data definition grid. By selecting each of the data variables in this list, the parameters defining the posting of each data variable may be specified without returning to the main form. Finally the Display Data Range menu is accessible from this menu by clicking on the Display Data Range button at the bottom of the screen. Any changes made from the menu can be discarded by clicking on the Cancel button, otherwise the changes will be saved if the OK button is clicked. |
|
Send mail to
john.paine@onaustralia.com.au with
questions or comments about this web site.
|